We’re going on a bug hunt (we’re not scared!)
We’re going on a bug hunt (we’re not scared!)
Using statsv for JavaScript error reporting
What happens when you have a bunch of JavaScript developers frustrated by not having any JavaScript error reporting in production? They find an unexpected workaround using the tooling they have available.
Coding in the dark
Wikipedia and its sister sites currently have no JavaScript error reporting. We have been using logstash for tracking server errors, but due to the fact we are a small volunteer-based non-profit supporting a top-10 website, some essential parts of the infrastructure end up being de-prioritized. As a result, every change we make has a high risk of causing errors. We lean heavily on JavaScript unit tests, Selenium integration tests, and Jenkins automation servers to prevent this as much as possible, but we can never be 100% sure that what we ship is bug-free.
Our team is currently in the process of investing in the front-end architecture of our mobile sites. The work is based on some tooling experiments that the same team performed earlier during the implementation of the page previews feature, nicely summarized by Joaquin Hernandez. While many of the ideas and lessons learned in that project apply here, there was one big difference that concerned us — rather than building something new we were refactoring a large codebase with technical debt that already lived in production.
The lack of client-side error reporting was concerning us, as the changes we were making were quite ambitious, and we were concerned that while making those changes, the likelihood of bugs would increase. Sentry was identified as a potential solution to this problem back in June 2015, but the work involved in that is non-trivial and spans many teams of various disciplines and we haven’t yet been able to find the bandwidth to work on this.
Rather than being put off by this, our team realized we could use our existing infrastructure to somewhat help with this situation. We currently use statsv (an HTTP beacon endpoint) to send data to Graphite (a real-time graph) as a lightweight way of collecting interesting data about our clients. We use this to plot Grafana graphs that provide at a glance metrics to allow monitoring of things such as opting into our mobile beta and errors with A/B test instrumentation. We check these often using a chore rota. We figured, that at the very least, we could count JavaScript errors and use that as a metric for the quality of our output. On the long-term, having such data would allow us to put together a case study detailing the importance of such tooling in our infrastructure, by linking it back to our users and the initiatives our donors were kindly funding.
The code was simple — if an error happens on the client, increment a counter.
Coding with the statsv light on
Turning the error logging on was a little daunting, as we had no idea how buggy our mobile sites were. We limited our change to the mobile site only (we run a separate mobile site, so were able to separate this change from traffic for our desktop users) and added an off switch in case the situation was direr than our optimism hoped.
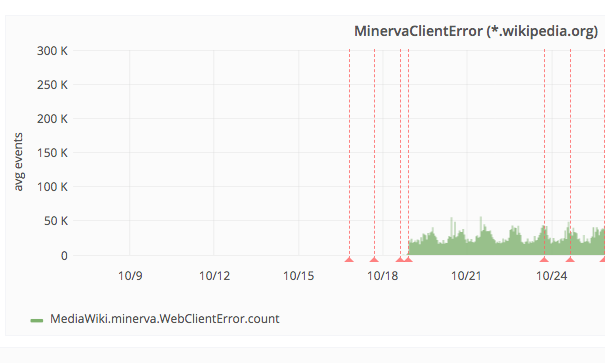
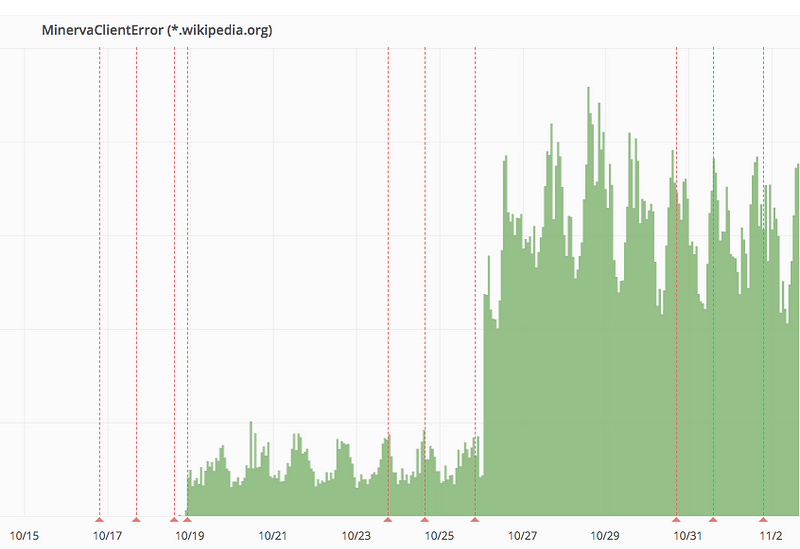
We enabled error counting on the 18th October and the errors starting rolling in (30,000 in the first five minutes). Our page views tend to fluctuate during a week, so we waited to collect a week's worth of data before drawing any conclusions. Within a week, the errors had peaked at 50,000 in a five minute period, so we now had a baseline. While high our site receives billions of monthly mobile page views so that’s not too bad.

However, then, on the 26th October, we had a new problem to solve.

On the 26th, the errors spiked. As part of our team chores, we opened a new bug ticket to track the problem. On average, we were now seeing 50,000 every five minutes — several magnitudes more than before. It was clear that something had broken, but we had no idea what had broken. After all, all we were doing was counting errors. We had no knowledge of the stack traces which would help us identify what code was causing the error and didn’t even know the language, URL or web browser it was happening on! Obviously, we knew this before enabling this metric and supposedly had made peace with this, only there was one thing we hadn’t counted on. We were developers...
Using the tooling we had to track down the error
For some reason, whenever hit with a problem, with the odds stacked against me, I’m always drawn to the childhood classic “We’re going on a bear hunt” by Michael Rosen (adapted from an American folk song). That book instilled into me at an early age, that any problem can be overcome by thinking outside the box, even the unusual practice of hunting bears. If you’re a parent of young children, I thoroughly recommend you grab a copy.
When I became a developer, I would often channel Michael Rosen during conversations about scope creep or edge cases. If you’ve ever worked with a team of developers, especially if you are a product owner, you will have noticed that we are a curious bunch, and if you distract us with a shiny problem, we’ll bite, and even if you don’t want us to… we’ll find the reason.

So, hit with the problem of an additional 30,000 client-side errors over the period of five minutes, even though early on, we recognized that counting errors would only tell us “when” an error occurred rather than “why”, it seemed worthy of further investigation. The only question was how.
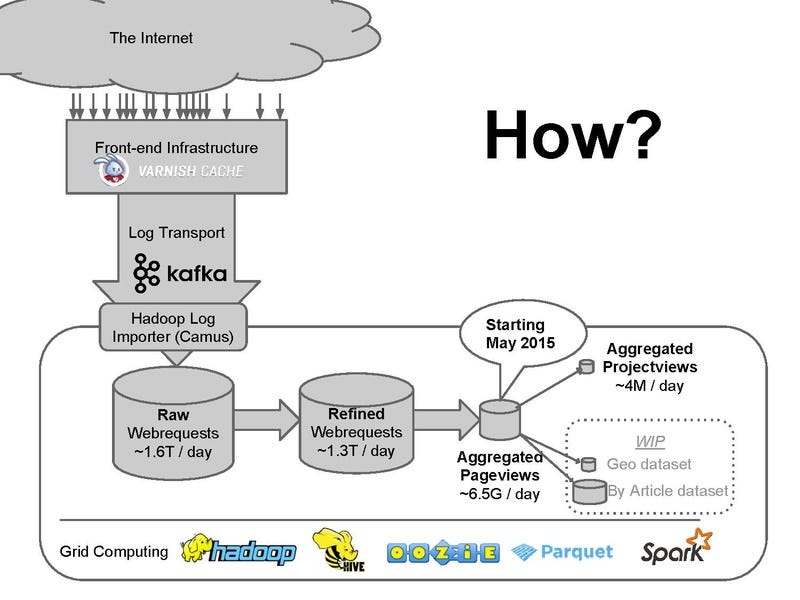
A work colleague outside our team in a casual conversation pointed out that statsv endpoints were GET requests, and thus went through our infrastructure to count page views. Armed with this information, it seemed we’d be able to glean some useful information about the errors we were seeing, based on data we were collecting for the purposes of monitoring site traffic.
Although we were only counting client-side errors, each of the requests being made to our statsv beacon to count these errors had a host of meta-data associated — notably, the Wikipedia language and domain that was being used; the referrer URL and most importantly the user browser agent.

By looking at the client side errors for a single day, we could run a series of Apache Hive queries to give more context on the errors we were collecting for a single day. I did just that, to see if I could glean any further information. I ran the following Hive queries:
#ALL ERRORS grouped by project:
select uri_host,namespace_id,count(*) from webrequest where day = 30 and month = 10 and year = 2018 and uri_path LIKE '%beacon%' and uri_query LIKE "%WebClientError%" group by uri_host,namespace_id;
# all errors grouped by user agent:
select uri_host,user_agent_map['os_family'],user_agent_map['browser_family'], count(*) from webrequest where day = 30 and month = 10 and year = 2018 and uri_path LIKE '%beacon%' and uri_query LIKE "%WebClientError%" group by uri_host,user_agent_map['os_family'], user_agent_map['browser_family'];
# all errors grouped by referrer:
select uri_host,referer, count(*) from webrequest where day = 30 and month = 10 and year = 2018 and uri_path LIKE '%beacon%' and uri_query LIKE "%WebClientError%" group by uri_host,referer;
Thankfully, these queries did help. While, grouping the errors by project did not shed much light, it ruled out the possibility that the bug was based on language or language-specific customizations. Likewise, grouping by referrer (e.g. the URL the user was on at the time they experienced the bug) showed no real trend — there were no problematic pages triggering more errors than the other. The user agent was the most valuable, the query helped me notice that the majority of the issues were coming from iOS (the iPhone), so I drilled down further looking at iOS by running the following Hive query:
select uri_host,user_agent_map['os_family'],user_agent_map['browser_family'],user_agent_map['browser_major'], user_agent_map['os_major'], count(*) from webrequest where day = 30 and month = 10 and year = 2018 and user_agent_map['browser_family'] = 'Mobile Safari' and uri_path LIKE '%beacon%' and uri_query LIKE "%WebClientError%" group by uri_host,user_agent_map['os_family'], user_agent_map['browser_family'], user_agent_map['browser_major'], user_agent_map['os_major'];
This Hive query showed me clearly that the bug was most prominent in iOS Safari (in fact 70% of all our errors were coming from this browser). Using browserstack (a tool that allows cross-browser testing), and my knowledge of the mobile stack (and code that had recently changed in the deploy that led to the bug), I took a look at one of the most common referrers and quickly I was able to replicate the bug quite quickly (on page load) — and thus hone in on the bug — an issue with some JavaScript templating code.
A happy ending
The bug was squashed promptly and the client side errors reverted back to its “normal” baseline shortly after we deployed the fix. We all sighed in relief.
One of the outcomes of our mobile site investment project is to improve test coverage. Not only had we shown that our error counting could identify new bugs, but we’d shown the impact of identifying and fixing existing bugs.
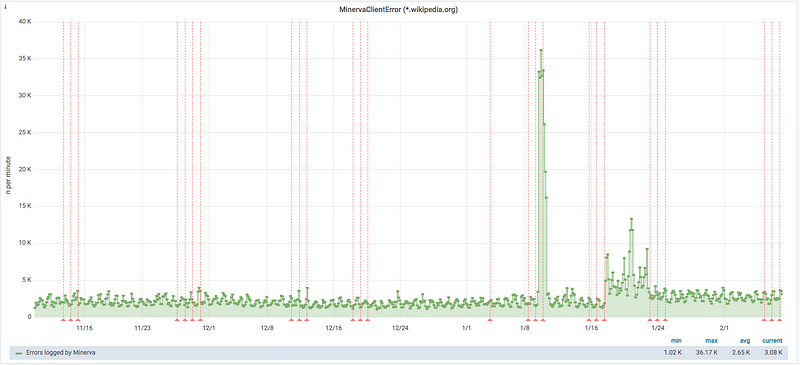
Since that issue in October, we’ve also identified two other issues via the same debugging method. In January we debugged and squash a much more impactful issue related to cached HTML as well as an issue with a volunteer-run banner campaign.
Hopefully, sometime soon, I can write about how Wikipedia has zero client-side errors.

Takeaways
Obviously, counting errors with statsv is not a sustainable way to run a website, and if you are being sent to this URI being told that you need to install statsv to count errors immediately, please kindly point that person to this section. If you want to count errors and have the resourcing to do such a thing, I highly recommend Sentry and/or its client-side SDK. The Wikimedia Foundation needs to get Sentry up and running, and we will catch up with doing that at some point in the future as soon as we can herd the correct team of people together.
So, what is the point of this article, if not to tell you about how to debug errors with statvs? Maybe it’s a reminder that engineers are paid to solve problems and that sometimes, being an engineer involves thinking outside the box and using the tooling you already have in creative unexpected ways. When we set out to count errors, as engineers we were not satisfied that it was the right way forward, but given it was low effort, we’ve already justified that work and more.
In this particular case, doing something unexpected with inappropriate tooling, was a great way to help non-technical people understand why JavaScript errors were something we should be capturing by making a hidden and unknown problem visible.
As anyone who has gone on a bear hunt will tell you, mountain-like problems can always be climbed given enough time and in absence of a bridge through the middle, while it’s tempting to give up altogether, sometimes we need to find other ways to get our message through.

